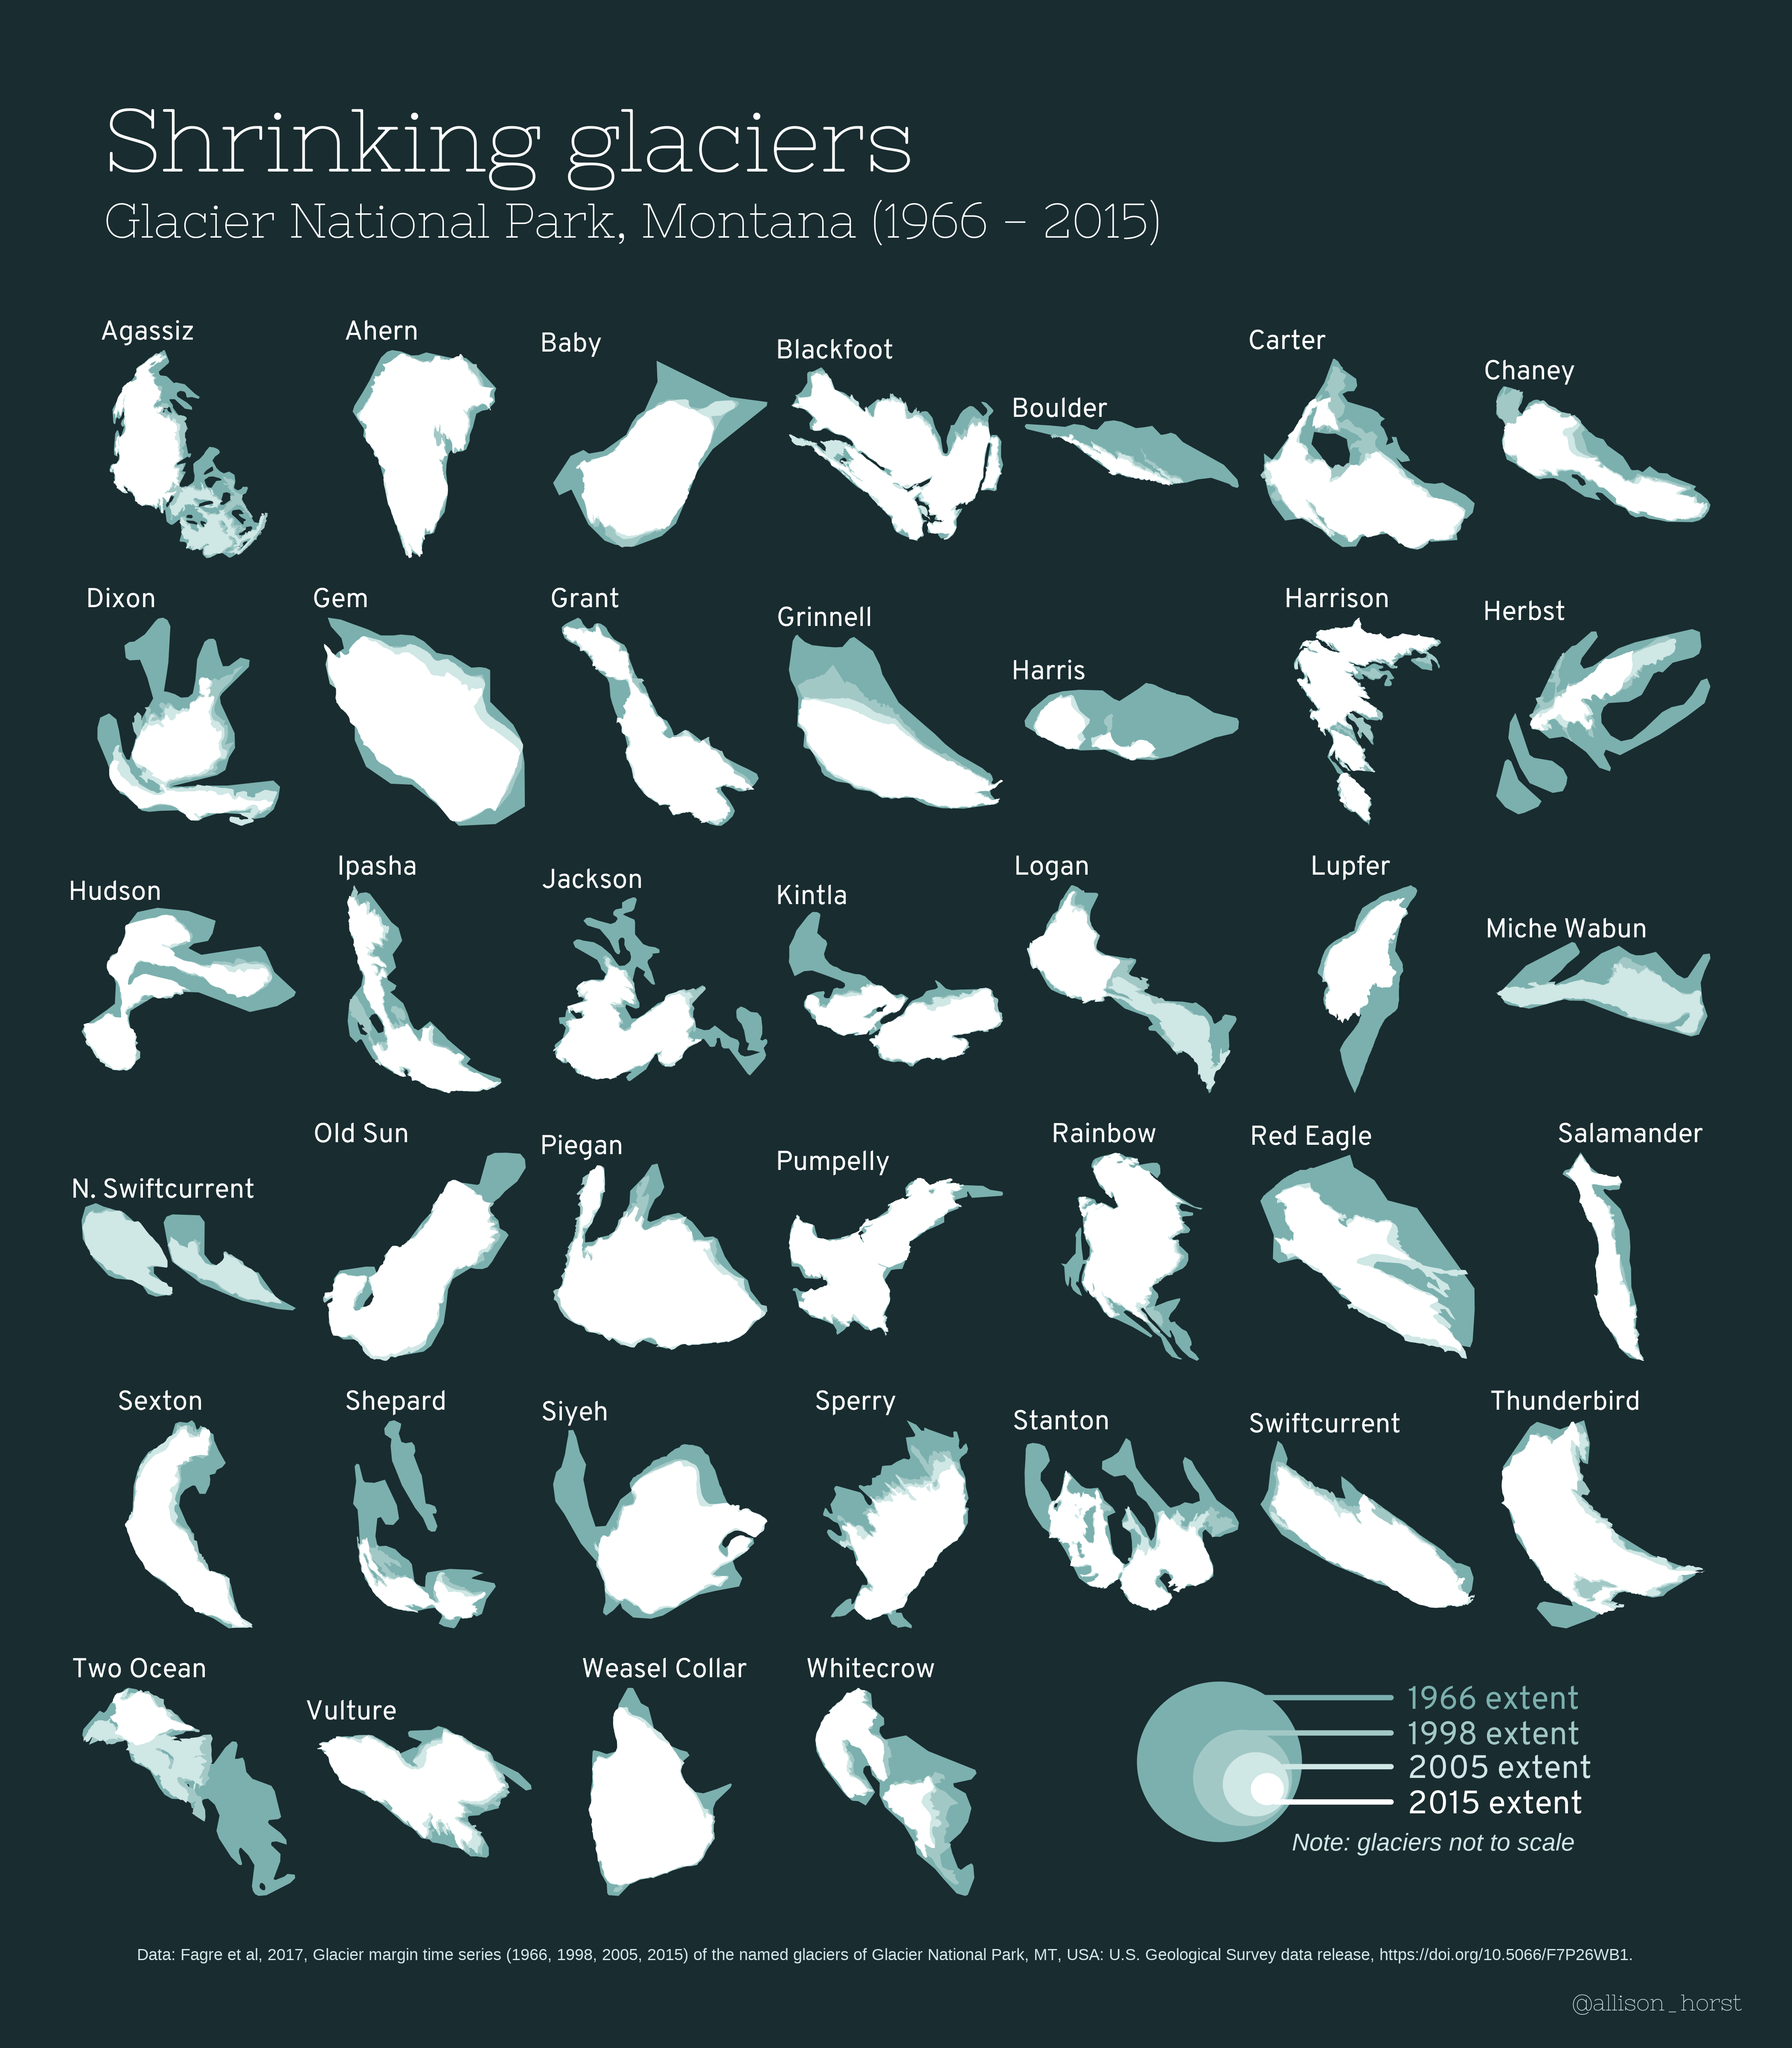
Losing icons: Disappearing glaciers of Glacier National Park, MT (1966 - 2015)

Author

Allison Horst

Published

March 11, 2022

Overview

Data visualization - glaciers at Glacier National Park (1966, 1998, 2005, and 2005).

Data: Fagre, D.B., McKeon, L.A., Dick, K.A., and Fountain, A.G., 2017, Glacier margin time series (1966, 1998, 2005, 2015) of the named glaciers of Glacier National Park, MT, USA: U.S. Geological Survey data release, https://doi.org/10.5066/F7P26WB1.

Attach libraries:

Code
library(tidyverse)
library(sf)
library(here)
library(cowplot) # For the plot grid
library(janitor) # For cleaning names
library(showtext) # For font changes
library(ggforce) # For geom_circle() in key
library(grid) # Add line segments for key

# Import font
font_add_google(name = "Overpass", family = "overpass") # add custom fonts
font_add_google(name = "Nixie One", family = "nixie")
showtext_auto()

Read in the data:

Code
glaciers_1966 <- read_sf(here::here("data", "GNPglaciers_1966")) %>% 
  janitor::clean_names() %>% 
  mutate(glacname = word(glacname , 1  , -2))
glaciers_1998 <- read_sf(here::here("data", "GNPglaciers_1998"))%>% 
  janitor::clean_names() %>% 
  mutate(glacname = word(glacname , 1  , -2))
glaciers_2005 <- read_sf(here::here("data", "GNPglaciers_2005"))%>% 
  janitor::clean_names() %>% 
  mutate(glacname = word(glacname , 1  , -2))
glaciers_2015 <- read_sf(here::here("data", "GNPglaciers_2015"))%>% 
  janitor::clean_names() %>% 
  mutate(glacname = word(glacname , 1  , -2))

Make the plot:

Code
# Set colors for different years:
col_1966 <- "#7bb0ae"
col_1998 <- "#a2c8c6"
col_2005 <- "#cfe7e5"
col_2015 <- "white"

glaciers <- purrr::map(glaciers_1966$glacname,
                       function(x) {
                         ggplot() +
                           geom_sf(data = filter(glaciers_1966, glacname == x), 
                                   fill = col_1966, color = NA) +
                           geom_sf(data = filter(glaciers_1998, glacname == x),
                                   fill = col_1998, color = NA) +
                           geom_sf(data = filter(glaciers_2005, glacname == x),
                                   fill = col_2005, color = NA) +
                           geom_sf(data = filter(glaciers_2015, glacname == x),
                                   fill = col_2015, color = NA) +
                           ggtitle(x) +
                           theme_void() +
                           theme(title = element_text(size = 40, 
                                                      color = "white", 
                                                      family = "overpass"
                                                      )
                                 )
})


glacier_grid <- cowplot::plot_grid(plotlist = glaciers) +
  annotate("text", 
           label = "Shrinking glaciers", 
           x = 0.02, y = 1.1,
           color = "white",
           family = "nixie",
           size = 55,
           hjust = 0,
           fontface = "bold") +
  annotate("text",
           label = "Glacier National Park, Montana (1966 - 2015)",
           color = "white",
           x = 0.02, y = 1.05,
           family = "nixie",
           size = 30,
           hjust = 0) +
  geom_circle(aes(x0 = 0.696, y0 = 0.09, r = 0.05), 
              fill = col_1966, color = NA) +
  annotate("text", label = "1966 extent", 
           color = col_1966, 
           x = 0.81, y = 0.130, 
           size = 20, 
           hjust = 0, 
           family = "overpass") + 
  annotation_custom(grob = linesGrob(gp = gpar(col = col_1966, lwd = 2)), 
                    xmin = 0.70, xmax = 0.80, ymin = 0.130, ymax = 0.130) +
  geom_circle(aes(x0 = 0.71, y0 = 0.08, r = 0.03), 
              fill = col_1998, color = NA) +
  annotate("text", label = "1998 extent", 
           color = col_1998, 
           x = 0.81, y = 0.108, 
           size = 20, 
           hjust = 0, 
           family = "overpass") + 
  annotation_custom(grob = linesGrob(gp = gpar(col = col_1998, lwd = 2)), 
                    xmin = 0.71, xmax = 0.80, ymin = 0.108, ymax = 0.108) +
  geom_circle(aes(x0 = 0.718, y0 = 0.076, r = 0.02), 
              fill = col_2005, color = NA) +
  annotate("text", label = "2005 extent", 
           color = col_2005, 
           x = 0.81, y = 0.087, 
           size = 20, 
           hjust = 0, 
           family = "overpass") + 
  annotation_custom(grob = linesGrob(gp = gpar(col = col_2005, lwd = 2)), 
                    xmin = 0.735, xmax = 0.80, ymin = 0.087, ymax = 0.087) +
  geom_circle(aes(x0 = 0.725, y0 = 0.073, r = 0.01), 
              fill = col_2015, color = NA) +
  annotate("text", label = "2015 extent", 
           color = col_2015, 
           x = 0.81, y = 0.065, 
           size = 20, 
           hjust = 0, 
           family = "overpass") +
  annotation_custom(grob = linesGrob(gp = gpar(col = col_2015, lwd = 2)), 
                    xmin = 0.730, xmax = 0.80, ymin = 0.065, ymax = 0.065) +
  annotate("text", label = "Data: Fagre et al, 2017, Glacier margin time series (1966, 1998, 2005, 2015) of the named glaciers of Glacier National Park, MT, USA: U.S. Geological Survey data release, https://doi.org/10.5066/F7P26WB1.", 
           x = 0.04, y = -0.03, 
           size = 10, 
           hjust = 0, 
           color = col_2005) +
  annotate("text", label = "@allison_horst", 
           x = 0.91, y = -0.06, 
           size = 14, 
           hjust = 0, 
           color = col_2005, 
           family = "nixie") +
  annotate("text", label = "Note: glaciers not to scale", 
           x = 0.74, y = 0.04, 
           size = 15, 
           hjust = 0, 
           color = col_2005, 
           fontface = "italic") +
  theme(plot.background = element_rect(fill = "#192c30", colour = NA),
          plot.margin = margin(85, 20, 40, 20))

ggsave(plot = glacier_grid, "glaciers.png", width = 7, height = 8, dpi = 600)
ggsave(plot = glacier_grid, "featured_glaciers.png", width = 7, height = 8, dpi = 600)