library(ggiraph)
library(palmerpenguins)
library(tidyverse)
library(patchwork)One cool thing: Interactive plots with ggiraph
Overview
The ggiraph package is another option for creating interactive graphics, sans Shiny and with a bit more control (and some cool features) compared to Plotly. If Plotly gets you what you want, no need to switch! But there are a few options that ggiraph provides that are pretty nice when you need them.
How do you pronounce that?
This may be the hardest part about ggiraph. It’s pronounced “giraffe.” There is a function within ggiraph that is girafe() (to create an interactive graph) with one “f” (how it’s spelled in French) - just be ready to forget if you need to use “giraffe” or “ggiraph” or “girafe” for a bit.
Basic example
First, let’s make a basic ggplot scatterplot: ::: {.cell}
ggplot(data = penguins, aes(x = flipper_length_mm, y = body_mass_g)) +
  geom_point(aes(color = species)) +
  theme_minimal()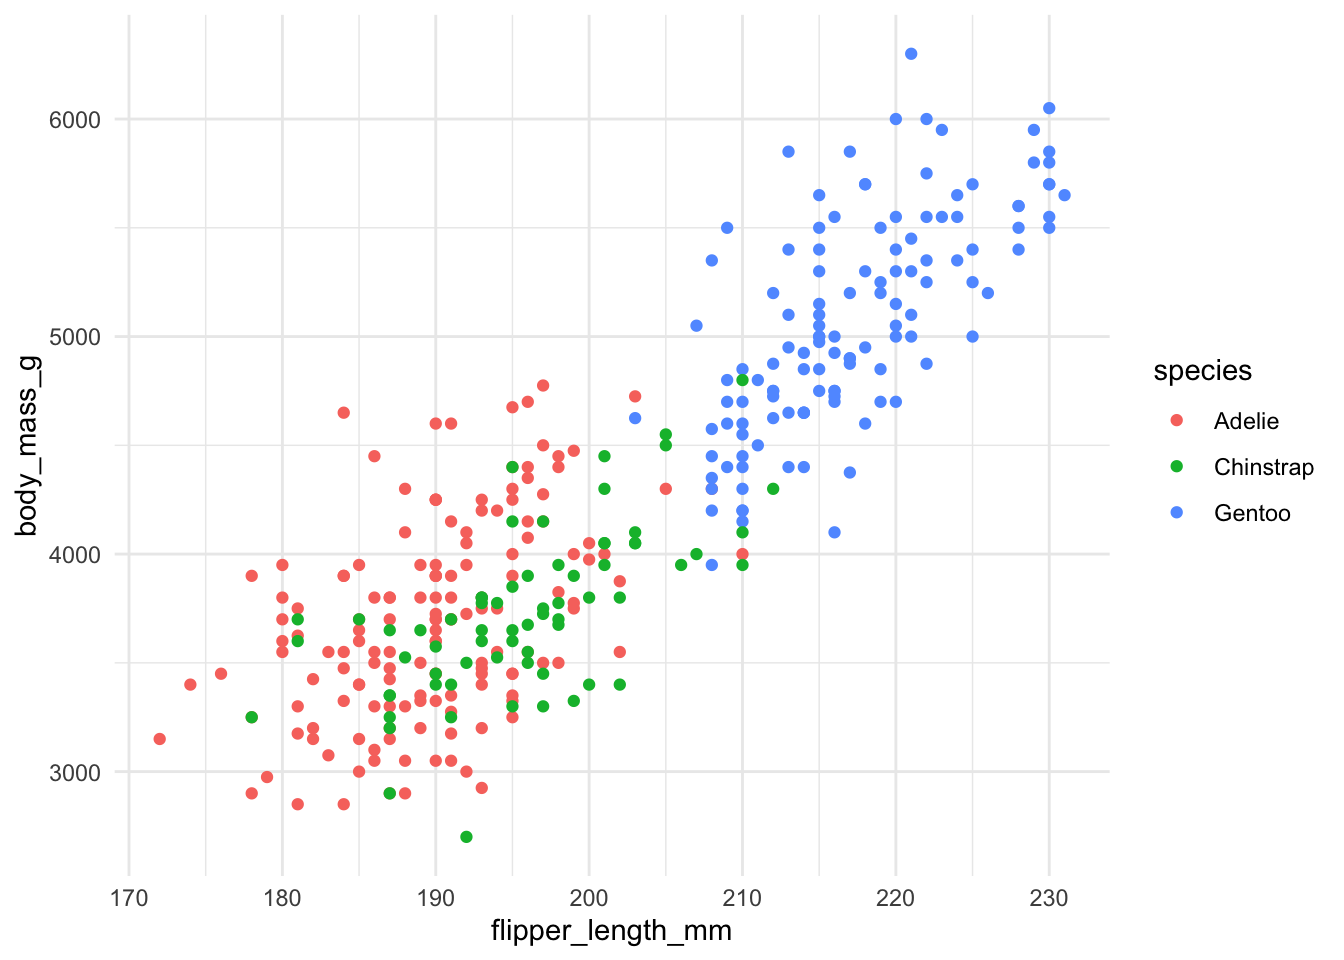
:::
Now, interactive: ::: {.cell}
p1 <- ggplot(data = penguins, aes(x = flipper_length_mm, y = body_mass_g)) +
  geom_point_interactive(aes(color = species, tooltip = species, data_id = species)) +
  scale_color_manual(values = c("cyan4", "darkorange", "darkorchid4")) +
  theme_minimal()
:::
girafe(ggobj = p1,
       options = list(
         opts_hover(css = "fill:black; stroke: yellow;"),
         opts_hover_inv(css = "opacity:0.2;"),
         opts_zoom(max = 10)
         )
       )
Alright let’s put a couple together: Copy and paste the p1 code from above. Switch out the flipper_length_mm and body_mass_g to bill_depth_mm and bill_length_mm
p2 <- ggplot(data = penguins, aes(x = bill_depth_mm, y = bill_length_mm)) +
  geom_point_interactive(aes(color = species, tooltip = species, data_id = species)) +
  scale_color_manual(values = c("cyan4", "darkorange", "darkorchid4")) +
  theme_minimal()
Now we’ll put them together with patchwork:
girafe(ggobj = (p1 + p2),
       width_svg = 8,
       height_svg = 4,
       options = list(
         opts_hover(css = "fill: black;"),
         opts_hover_inv(css = "opacity: 0.1;")
       ))
Other cool things:
- Works with
cowplot, too! - Shiny operability (including on-click reactivity)
- Cool ways to customize tooltips, hover effects, etc.
- Generally more control that you might get with
plotly
Learn more: